PRICE MONITORING
We monitor the market pricing for you. As many websites and as many products as you wish. Keeping an eye on the market has never been easier.

Customer happiness is our happiness


Here’s what price monitoring with Sniffie is built on
Get to know the key components of price monitoring using Sniffie
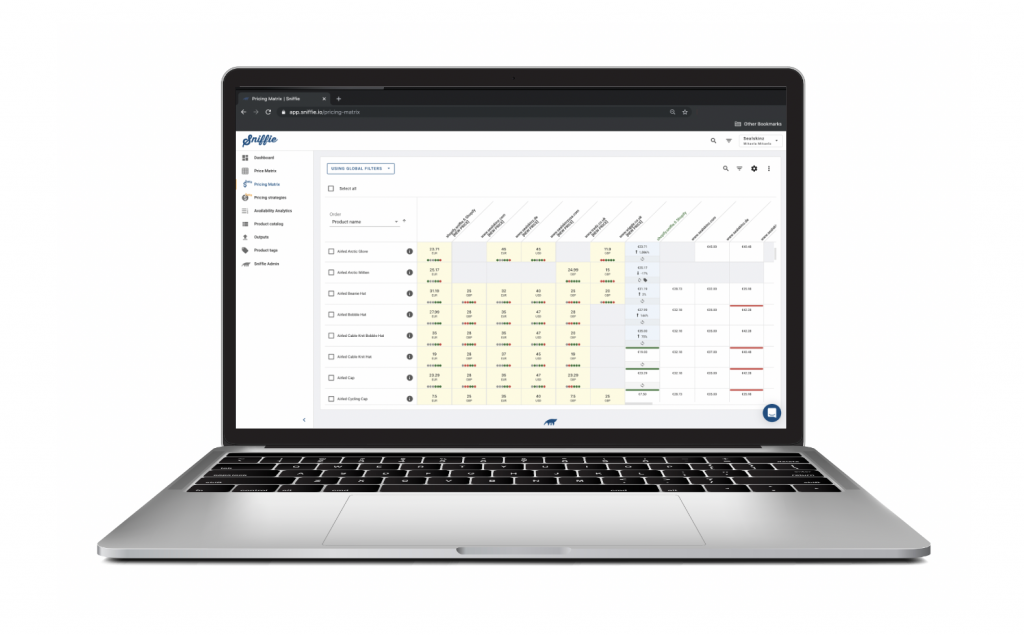
Price Matrix is a tool where you can see the market pricing in a simple matrix with enhanced statistical analyses readily calculated for your use.
Sniffie dashboards can be used for analysing pricing, category changes, sizes and other relevant details with live data. They can be adjusted like a Excel pivot to visualise live pricing and category data
Sniffie Master Data organizer lets your organize, change and enrich your reporting structure to live market data. It can be used to enrich data and move data structures to competing products as well.
With Sniffie’s Availability Matrix you are able to follow your competitors, react in relation to their product availability and even predict your competitors sales.
Meet (some) of our price monitoring clients:


Start making more profit
Turn team members into excited pricing ninjas by continuing to deliver value for their decision making.
With our pricing analytics tools you and your team can understand why certain pricing decision went right or wrong, which in the future let’s you keep an eye on what competitors are doing in a totally different way. Whether it’s a campaign or strategic pricing decision, you’ll be well informed when making decisions.
With pricing analytics, tailored to your needs you will receive simple and understandable reports that assist in the decision making process. Pricing is simple, when you know what you are doing. Team support and loyalty is not only possible – it’s as simple to achieve as it’s fun.
Use Sniffie to make improvements to your bottom line and become a true pricing ninja.

Frequently Asked Questions
We have a powerfool tool called Price Matrix. It is a simple matrix where you can simple see your prices against your competitors. That is then updated from to several times a day and it shows also if the competing products are out of stock, in campaign or not available.
You are able to change between several reference sites and therefore change which site your data is monitoring against. This allows you to use your own site or your competitors’ sites as a reference point.
Yes and it is called Price Matrix. That is the center of the price monitoring module. It is a visually simple yet specific and effective matrix showing you the price of all monitored products from all monitored competitors. You are able to filter down the data to a single category, a time range, certain websites or even view all changes together within a specific brand.
Our analytics are equipped with several standardized indexes that are automatically calculated for you and shown at the top of the Price Matrix. The following indexes are standard:
– CPI = Competitor price index, shows prices relative to common products prices, your own store is always 100 so a competitor having the index 110 means they are 10% more expensive.
– PPI = Product Price Index, an index is calculated for each product separately and PPI is the average of those indexes. Compared to CPI the difference is that all products no matter price has the same weight in the PPI. Your own store always has the index 100.
– MPI = Market Price Index, store sum of all products compared to the market average, excludes your store
– MPI (full) = Market Price Index, store sum of all products compared to the market average, includes your store
– Products = amount of products included in the index calculation. Missing price points are not included in this
– Common products = amount of products in common between stores.
Absolutely. You can easily export the data from the Price Matrix as matrix or list in either XLS, XLXS. or CSV. That goes to dashboards and to individul widgets there as well.
Yes, you can sort the Price Matrix based on different factors such as product name, min, max, avg etc. You can also sort your price matrix view in a way that shows your price relative to market minimum.
Even to one simple if you need. It’s called quick search and it is an option that lets you search products in the price matrix that have product names attached to them in the product catalogue.
You can save your filtering results to your own views in Price Matrix. It is called my views and you can name those so it is easy to find later from the dropdown menu in Price Matrix.
Yep. You can set Price Matrix to only show you easy statistical analytics of max, min, avg, median, mode, q1, q3 and penetration.

