Keep your prices competitive with our price monitoring software for Google Shopping or dedicated websites.
Used by 500+ companies
Trusted by teams at
Improve pricing with Price Monitoring
Keep your prices competitive with our price monitoring software for Google Shopping or dedicated websites.
Used by 500+ companies
Trusted by teams at
COMPLETE MARKET VIEW
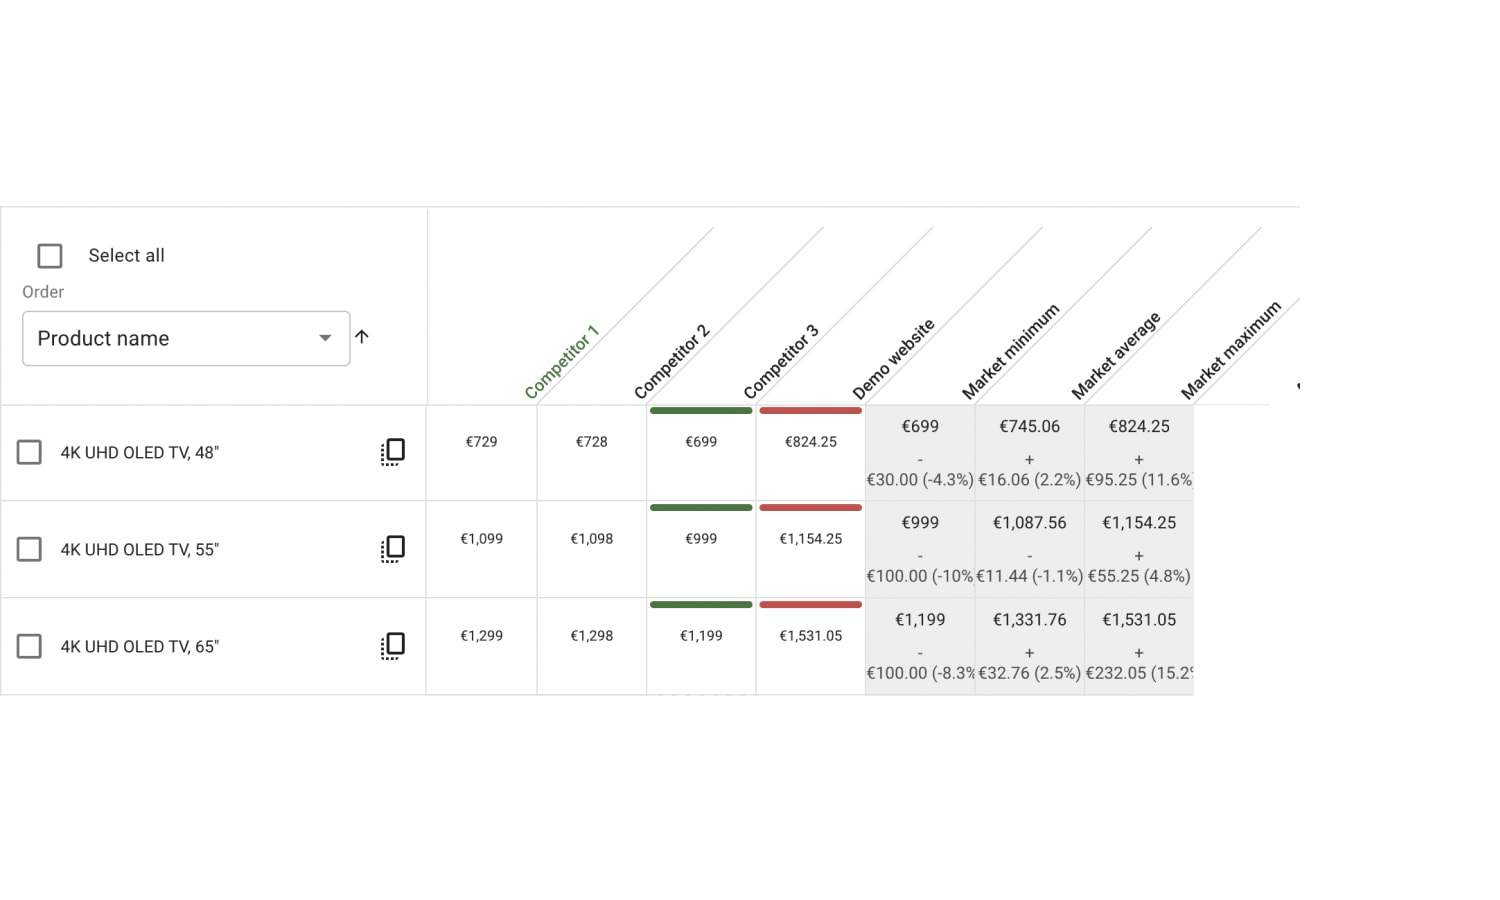
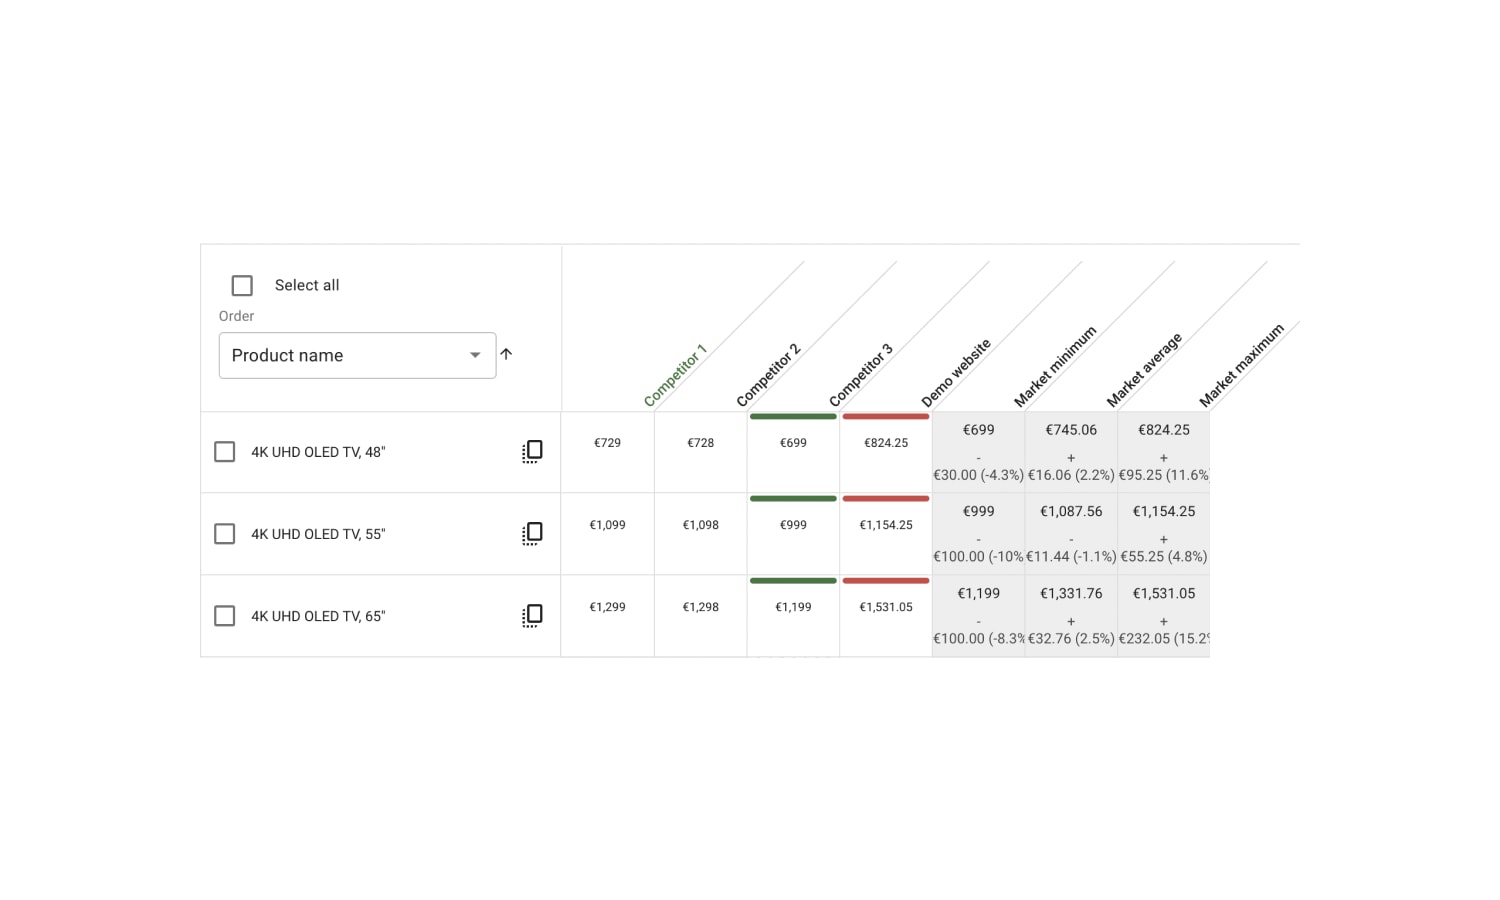
Live competitor pricing data with 99,9% accuracy
Enjoy live and broad overlook of the market pricing, campaigns, and price changes of your competitors — all at one glance.
AUTOMATIC ALERTS
Stay up to date on market changes
Stay ahead of the competition by knowing when to react and when to stay put.
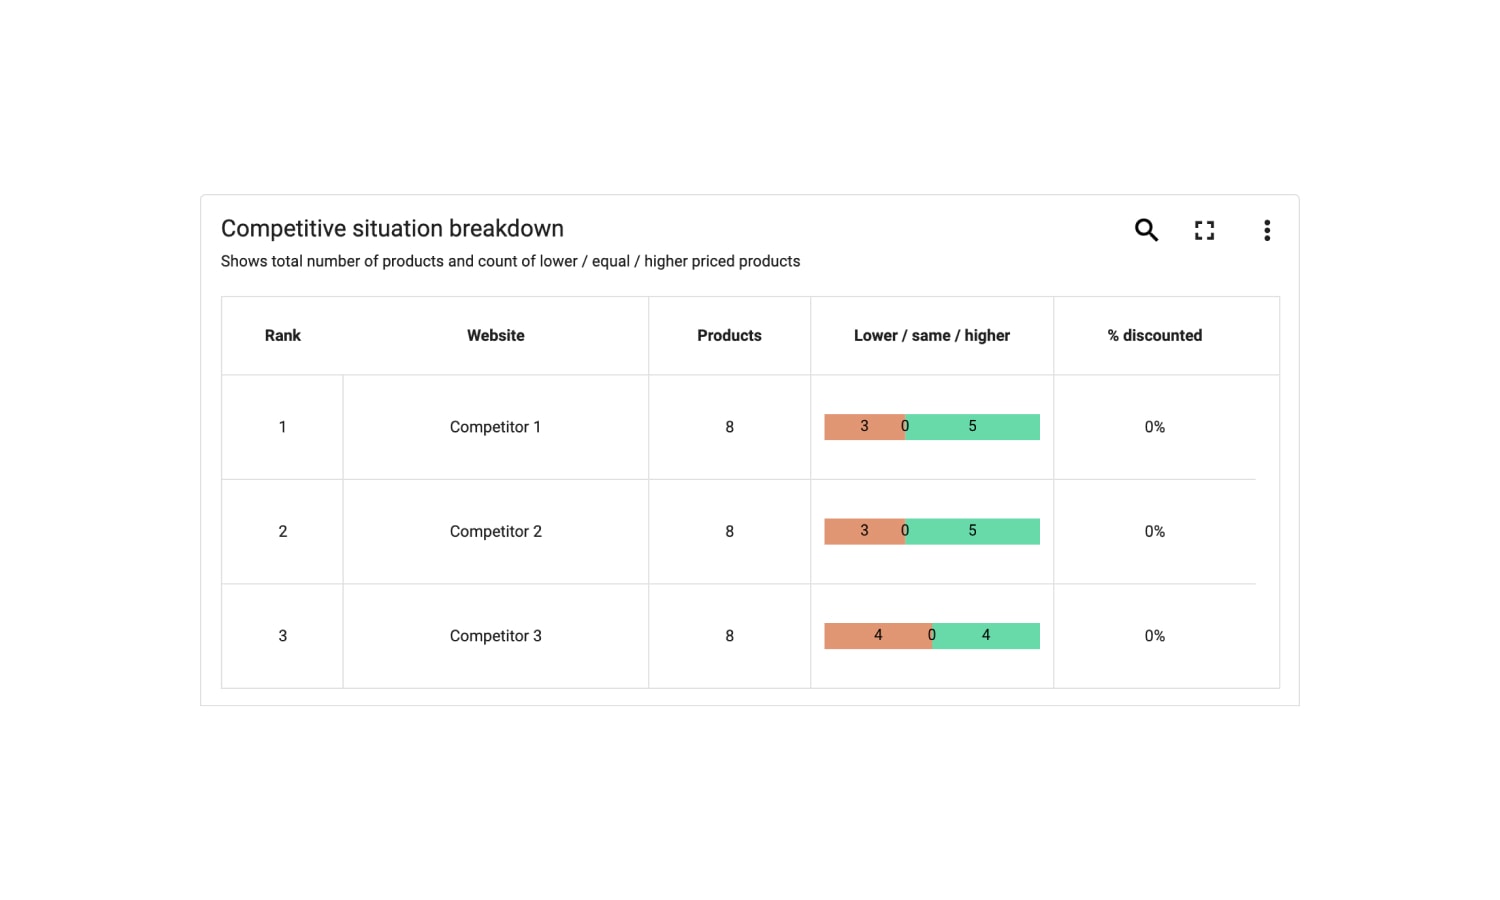
ACCURATE ANALYSIS
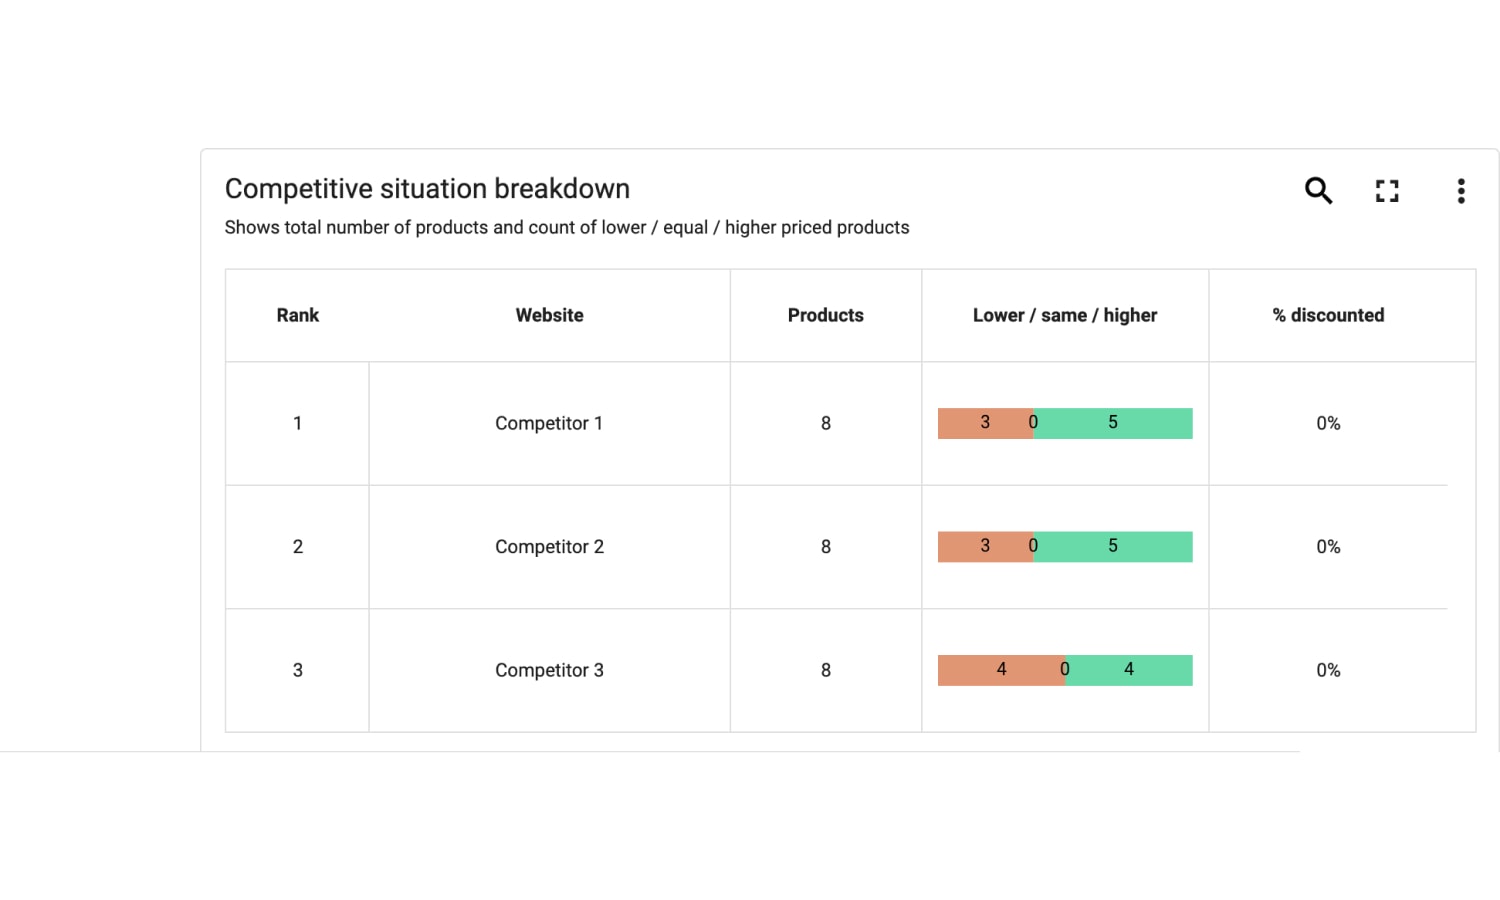
Accurate analysis on any level
Analyze your market situation on any level you want. Do analytics on company, category, brand or product level. We guarantee a high accuracy for collected price tracking data and product matches.
Enjoy live and broad overlook of the market pricing, campaigns, and price changes of your competitors — all at one glance.
AUTOMATIC ALERTS
Stay up to date and get alerts on market changes
Stay ahead of the competition by knowing when to react and when to stay put.
ACCURATE ANALYSIS
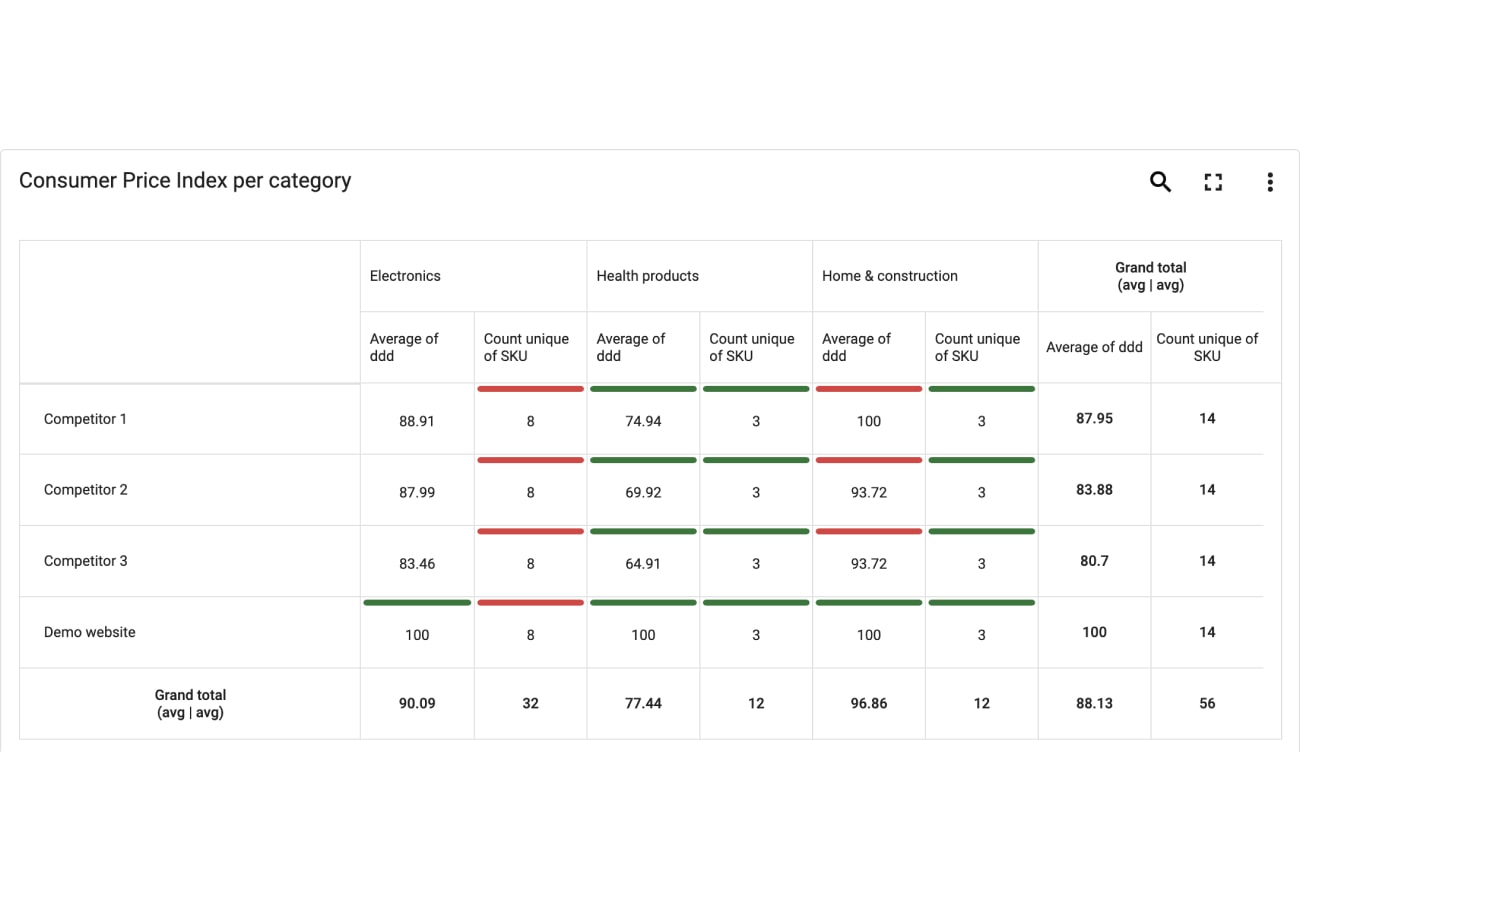
Accurate analysis on any level
Analyze your market situation on any level you want. Do analytics on company, category, brand or product level. We guarantee a high accuracy for collected price tracking data and product matches.
Enjoy live and broad overlook of the market pricing, campaigns, and price changes of your competitors — all at one glance.
AUTOMATIC ALERTS
Stay up to date and get alerts on market changes
Stay ahead of the competition by knowing when to react and when to stay put.
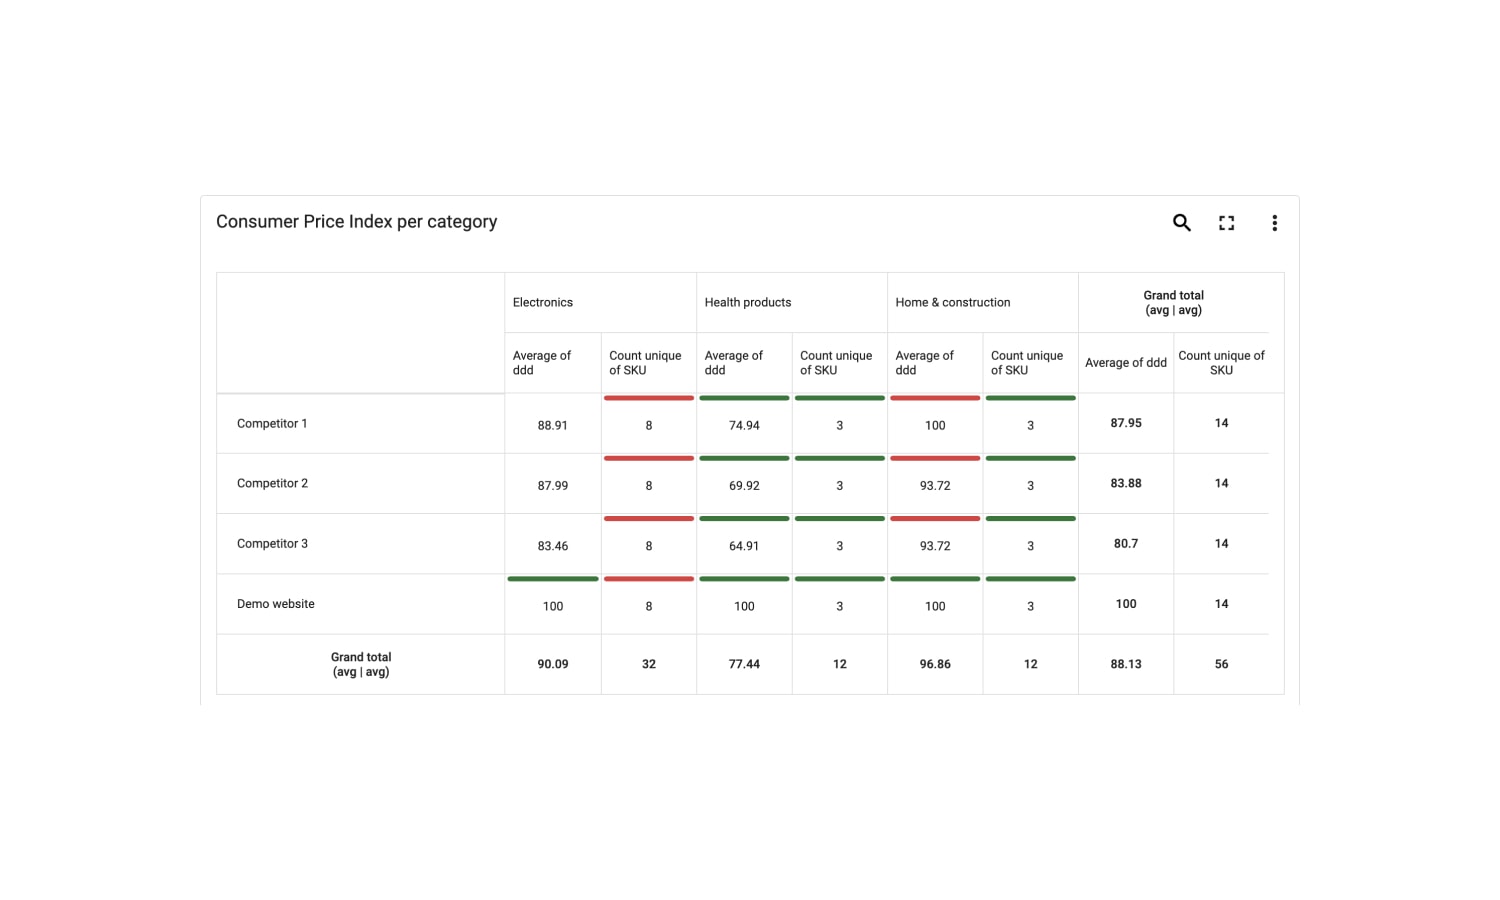
ACCURATE ANALYSIS
Accurate analysis on any level
Analyze your market situation on any level you want. Do analytics on company, category, brand or product level. We guarantee a high accuracy for collected price tracking data and product matches.
“In the world of fast changing prices Sniffie has helped us to save time and earn higher revenues with price monitoring. It is a vital part of our weekly management routines”
You can monitor competitor prices online with web scrapers that visit websites and collect pricing information. The pricing information is then cleaned, structured, and compared to similar products on a product or company level.
Yes you can. Our customers use different integrations to support their data needs. We have ready made integrations and we also support you custom integrations.