Are you seeking to enhance your pricing strategy or gain deeper insights into how pricing affects your business? Creating a pricing dashboard for your Retail or Ecommerce team could be highly advantageous. Not sure where to begin? Here’s a straightforward guide that covers what a pricing dashboard entails, which KPIs to prioritize, and how to get started.
What is a pricing dashboard?
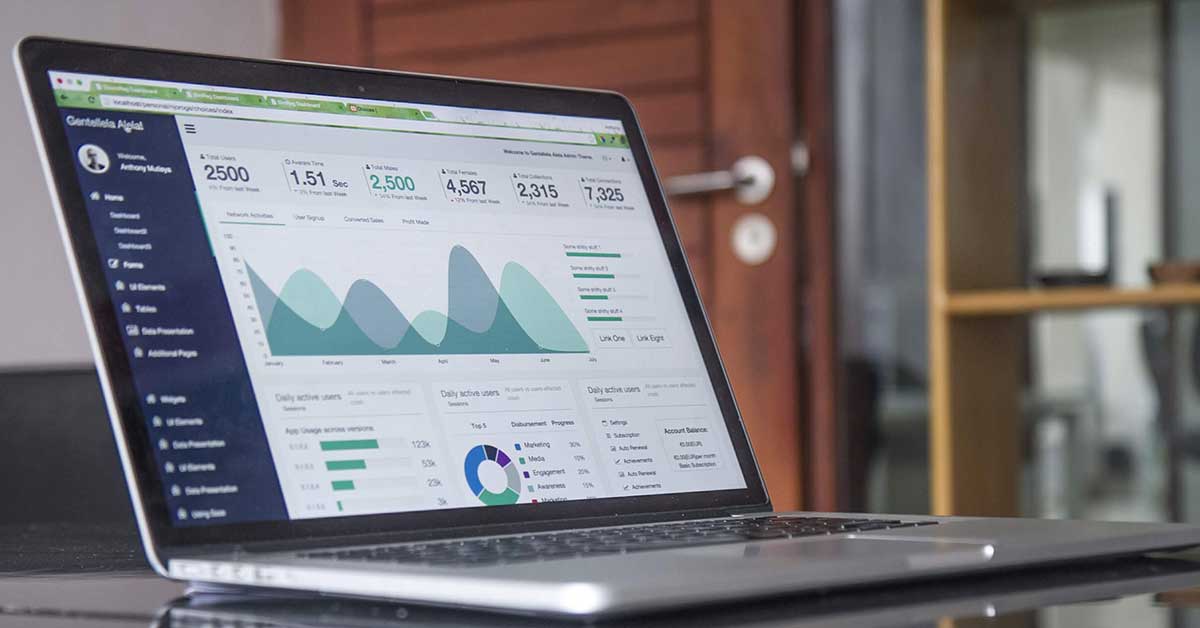
A pricing dashboard consolidates and visualizes key performance indicators (KPIs) related to Ecommerce or Retail pricing. It enables teams to easily monitor crucial data such as sales volume, revenue, and gross margins, facilitating informed decision-making about pricing strategies.
Automatic Pricing Dashboard
See how Sniffie’s automatic Pricing Dashboard can help your business thrive.
Planning a pricing dashboard
When creating a pricing dashboard, you should begin by thinking with what matters most to you and your team. Having a bloated dashboard helps no one. The data you show has to mean something to your team daily and only include critical metrics. As your team usually interacts with specific tasks, uses historical data trends for their use cases, and compares performance across different products and categories, they only use the data if it helps them.
Characteristics of a good pricing dashboard
An effective dashboard tracks the performance of pricing strategies and enables timely adjustments based on data. It should be intuitive, ensuring team members understand their roles and can act on the insights provided. The benefit of the dashboard will only come once your team understands which pricing strategy works and which areas need improvement.
Choosing KPIs for a pricing dashboard
Select Key Performance Indicators (KPIs) that reflect the core aspects of your business. Below, we have listed some of the main KPIs that you could use, explaining what they mean. We have split them into five main categories: Profitability, Demand and Volume, Market Data, Revenue, and Forecasting.
Overview of our selected KPIs
Profitability KPIs
Gross margin
This metric shows the company’s profit from sales after accounting for the cost of goods sold. It’s a good indicator of the overall health of product pricing. Especially important is what you include into your COGS. For instance in e-commerce, you should as many attributes as possible such as returns, costs of acquisition etc. as these play major role in the overall picture.
Operating margin per product
Also known as operating profit margin, this is a financial metric that measures a company’s profitability after considering operating expenses. When you extrapolate the fixed costs to your products you get more clarity into how profitable your pricing really is. As high Gross Margin might quickly be diluted with high operating expenses. The simplest way to create this KPI is to take a percentage of revenue a product is bringing in, and allocate the share of operating expenses for the overall sales of that product.
Share of profitable revenue
This KPI expresses the share of revenue that represents the business’s profit per product, category or brand for example. It’s usually calculated by dividing the share of profit by the share of revenue and multiplying by 100. A higher share of profitable revenue indicates a more efficient pricing or better demand. This way you know what products actually matter to your business.
Average margin
This KPI measures the average profit margin (gross margin) for a company, product, or category of products. It’s usually calculated by dividing the profit by the revenue and multiplying by 100. It’s a good measure of how well the products are doing financially.
Average margin per lifecycle
This compares the average margin of the product during its entire lifecycle. It helps to understand how the margin changes over time and identify the most profitable periods of a product’s lifecycle.
Margin target vs. real margin
This KPI compares the company’s actual margin to your target. If the actual margin is lower than the target, it indicates that there may be a need to adjust prices, reduce costs, or increase sales to improve profitability. Sometimes this also indicates unnecessary campaigning and too high discounts.
Most profitable categories and products
This metric helps to identify the most profitable products and categories of products. It can be useful to adjust your pricing strategy to optimize the profitability of your business.
Category weight in portfolio
This KPI measures the percentage of total sales that a particular category of products represents within a company’s product portfolio. It can help you to compare categories or brands.
Demand and Volume KPIs
Price elasticity of demand
This measures how sensitive customers are to changes in your pricing. You can easily calculate it automatically from your sales data to each products. A high price elasticity of demand means that a slight price change will result in a large change in the quantity demanded. This can be used either on individual or grouped level to understand your pricing gateway.
Sales volume
The number of units sold over a specific period of time is a crucial metric to measure. It tells you how some products are sold and when planning those price changes with the elasticity you can make a pretty close judgement how your pricing is going to affect your volumes.
Stock amount
You also want to monitor the number of products you have in stock. This helps you see how the stock you have is doing and whether you should soon get rid of it.
Days of supply
This measures how long it will take for your company to sell through the current inventory based on current sales rate. Simplified, you can calculate it by dividing the units in inventory by the number of units sold per day. A lower number of days of supply indicates that a product is selling quickly and may need to be reordered or that prices may need to be adjusted. Especially important in high-volume businesses as in seasonal businesses like fashion.
Average weekly and monthly volumes
This measure the average number of units sold per week or per month, it can be calculated by dividing the total volume by the number of weeks or months in the given period. It gives you an insight of how consistent the sales are.
Sales volume forecast
This KPI predicts how many units of a product you will be sell in the future. Forecasting sales volume can help you plan for future inventory needs and make more informed pricing and buying decisions. The forecast is based on historical sales data, industry trends, and other factors such as new product launches, marketing campaigns, inflation and upcoming holidays, etc.
Market Data KPIs
Competitor prices
Keeping an eye on your competitors’ prices will help you understand market trends and adjust your pricing strategy accordingly. It can also be used for dynamic pricing if needed.
Market share
The percentage of total sales in a specific market that a company holds.
Competitor Price Index (CPI)
A Competitor Price Index (CPI) is a metric that measures the relative pricing of a company’s products compared to its competitors. It helps you understand where you stand in terms of pricing relative to the competition, and it can be used as a key performance indicator (KPI) to track the effectiveness of a company’s pricing strategy on different levels. To calculate the CPI, you need to choose a set of comparable products from your company and your competitors and then compare their prices. You can find clear guidance on how to create on from our Pricing Academy.
Price change calendar
A competitor price change calendar is a tool that tracks changes in pricing made by your competitors over time. It can be a valuable KPI for your pricing dashboard, as it can help you understand market trends and adjust your pricing strategy accordingly.
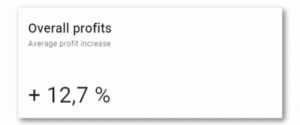
Revenue Development KPIs
Revenue development
This KPI tracks a company’s revenue and overall growth or decline over time. Good tip is to present it as a percentage increase or decrease compared to a previous period.
Daily, weekly, and monthly revenue
Similar to Revenue Development, this KPI measures the amount of revenue generated by sales of a particular product or category of products over a certain period of time. It can help you identify trends in revenue over time and understand the impact of pricing changes on your business. Easy filtering needs to adjust for your dashboard to enable effective use of this KPI.
Daily revenue versus profit
This KPI compares the revenue generated by sales each day to the profit earned. It’s essential to monitor revenue and profit to understand the financial performance of your business. While high revenue is generally a good thing, it’s not always an indicator of profitability. As said also above, a drill down is often needed. Good and effective filtering will sort this out.
Forecasting KPIs
Sales forecast
This KPI predicts future sales of a product or category of products. A sales forecast can help you plan for inventory needs and make more informed pricing decisions. It is based on historical sales data, and can include industry trends, and other factors such as new product launches, marketing campaigns, and upcoming holidays.
Profit forecast
Similar to the sales forecast, this KPI predicts future profit of a product or category of products. Profit forecast will give a clear picture of how profitable the sales forecast will be, and if any adjustments are needed for pricing strategy.
Volume forecast
This KPI predicts your future volume of a product or category of products. Similar to sales and profit forecast, this will give a clear picture of how many products are expected to sell in the future, with the given pricing and help to plan for inventory and production needs. To make the most of it, you should always consider enhancing the forecast models with elasticity information to understand how much individual changes affect.
Average inventory compared to sales
This metric compares the average amount of inventory on hand to the average daily or weekly sales. It can help you understand how quickly products are selling and whether or not you have the right amount of inventory on hand. A high average inventory compared to sales may indicate an overstock issue, and that prices need to be adjusted or inventory needs to be reduced.
How do you create a pricing dashboard?
Creating a pricing dashboard is a pretty straightforward process, yet it requires some concentration to detail. Here is a simple list to know where to begin.
Set objectives
Firstly, define the goals and objectives of your dashboard: Before building your dashboard, it’s important to have a clear understanding of what you want to achieve with it. Identify the key performance indicators (KPIs) that your business needs. Simplified: what are the details you want to track and the information that you want to present in the dashboard?
Gather and organize data
Collect data on the KPIs that you want to track. This data can be sourced from your systems or from external sources such as market research by scraping or buying data. Organize the data in a way that makes it easy to analyze and understand.
Choose the data warehouse
Choose a place to store that data. A good data warehouse is essential if you don’t have a ready-made tool or pricing master to do it for you.
Choose a dashboard software or tool
There are a variety of software and tools available for creating dashboards. Depending on your budget and technical capabilities, you can use a spreadsheet program like Excel, a specialized dashboard software, or a cloud-based service like Google Data Studio, PowerBI or Tableau. Naturally, if you use pricing softwares like Sniffie you will have that module embedded into your pricing master.
Design the dashboard layout
Decide on the layout and design of your dashboard. The design should be simple, easy to read and understandable.
Make relevant visualisations
Use visualizations and charts to present data in an easy-to-understand format. Ensure your team can easily filter the visuals to the level they need.
Test and refine
Test the dashboard and get feedback from users. Make adjustments based on feedback and keep iterating to ensure the dashboard is meeting its objectives and providing the insights you need.
Keep it up-to-date
Once your dashboard is complete, it’s important to keep it up-to-date by regularly refreshing the data and making adjustments as needed. This will ensure that the dashboard remains relevant and is the hub for your pricing team decisions.
Additionally, it can be very helpful to automate data update process to ensure that the dashboard is always up-to-date. This will help to avoid human error, save time and provide access to the most recent data.
It’s also important to keep in mind that a pricing dashboard is not a one-time project, it’s a continuous process that requires maintenance and updates to reflect the current market situation, new business goals and changing strategies. By regularly monitoring your pricing dashboards, you’ll be able to identify trends and make data-driven decisions that optimize the performance of your business.
Subscribe to our newsletter: